
What Webcast Engagement at Mining Forum Americas 2025 Reveals
By combining webcast engagement data with first-hand viewing, you gain both the signal of investor interest and the substance of company performance—a uniquely powerful combination in today’s crowded


In a sector crowded with press releases, conference calls, and analyst notes, investors often seek a clear signal of where the market’s attention is actually focused. One of the most overlooked yet revealing signals comes not from trading screens but from webcast statistics.
When management teams present at investor forums, the number of views and, more importantly, the average time investors spend watching, becomes a real-time proxy for investor interest and focus. Unlike stock price moves, which can be driven by short-term flows or external news, webcast engagement reflects deliberate investor behavior: who investors choose to listen to, and how long they stay engaged.
With Mining Forum Americas 2025 webcast views expected to pass through 15,000 by this Friday (two weeks of on-demand viewing), it is a treasure trove of proxy insights. Note: Denver Gold Group counts authentic views and does not inflate traffic by referencing “hits” and other spurious metrics
The Value of Webcast Statistics for Investors
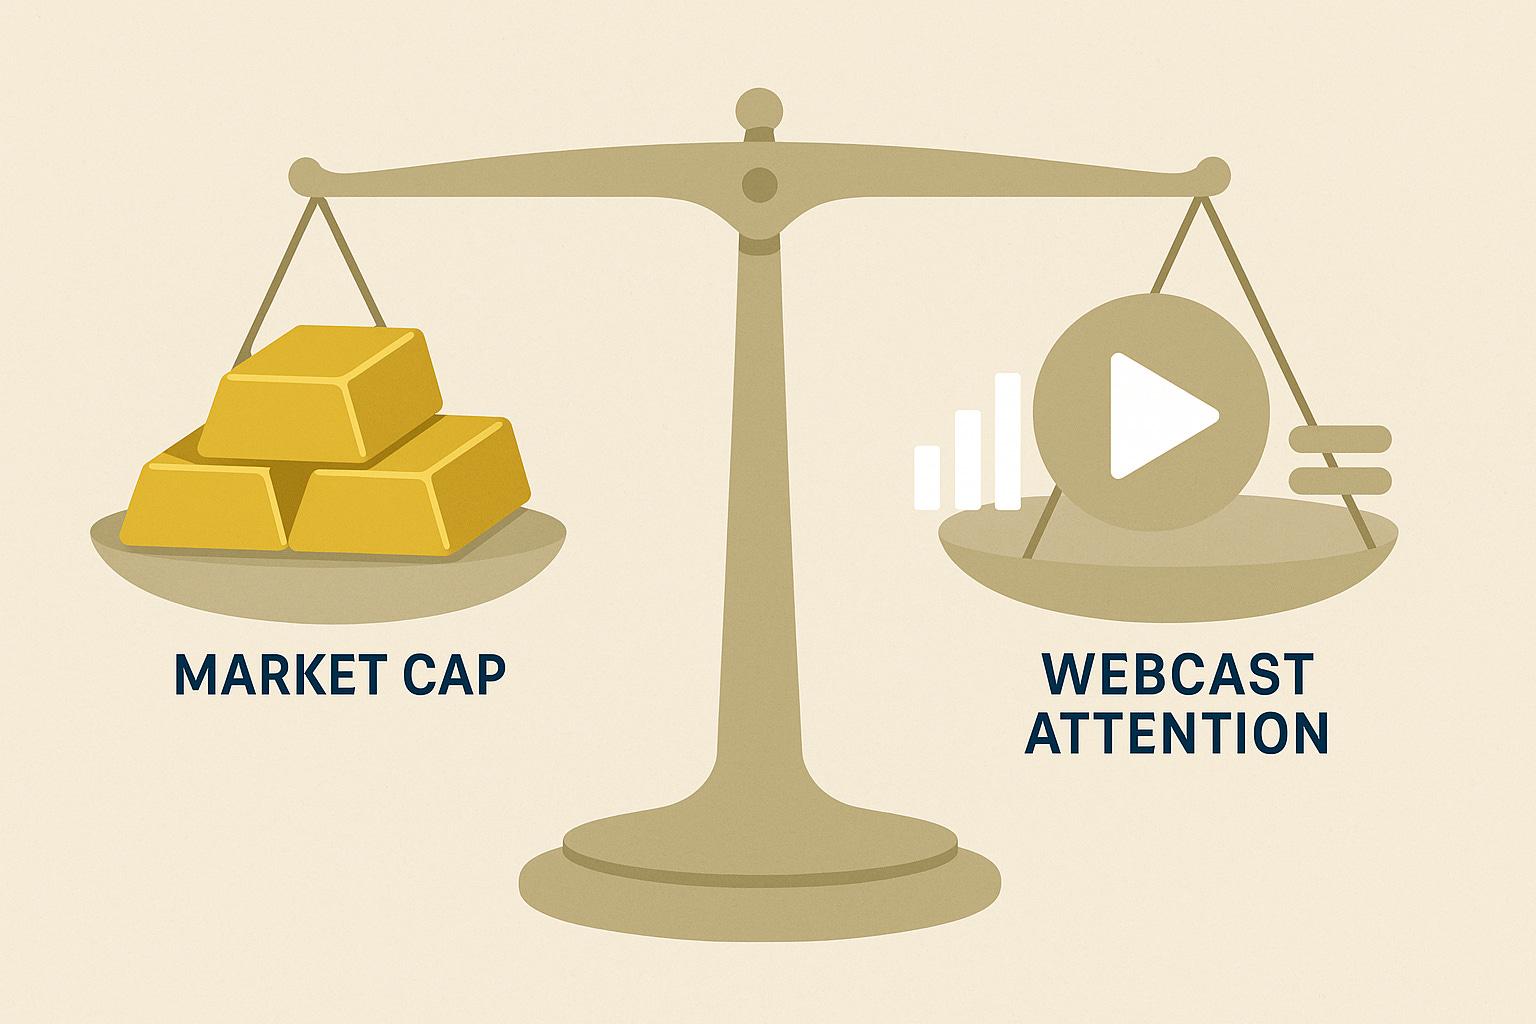
Beyond Market Cap: Measuring “Mindshare”
Market capitalization tells us how the market currently values a company’s assets and prospects. But it doesn’t tell us how much attention investors are giving to management’s message.
A smaller-cap explorer may attract a surprisingly high level of webcast engagement, signaling that institutional and other investors are taking a closer look.
Conversely, a major producer may draw fewer sustained views than expected, suggesting fatigue or lack of differentiation.
This “mindshare gap” can point to undervalued momentum stories or highlight where market narratives are wearing thin.
Average Duration as a Quality Signal
Total views measure reach, but average time watched measures conviction. Investors will click on many presentations; they only stay with those they find compelling.
A webcast with fewer views but a very high average duration often reflects a more targeted and deeply engaged investor base.
High drop-off rates, by contrast, may indicate weak messaging, misalignment with investor priorities, over-saturation in the company’s story, or poor presentation skills.
A Proxy for Sector Focus
By aggregating webcast statistics, we can trace shifts in market attention across geographies, commodities, and company sizes. Engagement data often anticipates where investor capital is likely to move:
For example, spikes in viewing among a cluster of copper developers may foreshadow a thematic rotation into that base metal.
Consistently high engagement for select royalty companies could indicate a growing appetite for lower-risk yield plays.
In this way, webcast statistics function like a weathervane for sector sentiment.
Relative Engagement: Leveling the Field
Introducing a Relative Engagement score—which adjusts webcast performance by company size—adds another layer of insight.
Smaller companies that punch above their weight in webcast engagement stand out as highly valued stories on investor radars.
Larger firms with middling relative engagement may signal that their visibility is high, but investor enthusiasm is cooling.
This normalization helps investors avoid being blinded by scale and instead identify where incremental interest is building most sharply.

Top 40 Companies by Relative Engagement
Below is the ranking of the top 20 companies whose webcasts outperformed expectations once adjusted for market capitalization. The Denver Gold Group Relative Engagement score is normalized to 0–100, while the Denver Gold Group Webcast Engagement Index (WEI) Index shows the raw engagement blend of total views and average time watched.
Note that there are two pages - click between pages at the top right of the table.
About the Metrics
Webcast Engagement Index (WEI)
The WEI combines two dimensions of webcast performance:
Reach (total number of views)
Quality of engagement (average time watched)
Each company’s WEI score is normalized to a 0–100 scale so results are directly comparable. A higher WEI means the webcast drew a larger audience and held viewer attention longer.
Relative Engagement
Relative Engagement adjusts the WEI score for company size (market capitalization). This highlights companies that “punch above their weight” — generating webcast engagement that is disproportionately strong relative to their market value.
High WEI + High Relative Engagement → Established leaders with strong visibility.
Moderate WEI + High Relative Engagement → Smaller or mid-cap companies outperforming expectations in audience impact.
High WEI + Lower Relative Engagement → Large companies with scale advantage, but engagement levels in line with their market size.
Even Investor Attention Across Metals
The webcast engagement data shows that investor interest was remarkably balanced across the primary metals. Gold, silver, and copper companies all recorded similar levels of relative engagement once adjusted for market capitalization.
This even distribution suggests that investors are not sharply rotating into or out of a particular commodity theme. Instead, they appear to be casting a broad net across precious and base metals, keeping exposure diversified while waiting for clearer price or policy signals to drive stronger allocation decisions.
For gold, the consistency reflects its role as the sector’s anchor: investors reliably tune in to hear from producers and developers regardless of short-term price fluctuations. Silver companies showed a near-identical profile, underscoring their appeal as a high-beta precious metal trade. Copper, often viewed as a growth and electrification play, also matched this engagement, reinforcing that institutional investors are watching both defensive and growth-oriented metals with equal focus.
In short, webcast statistics reveal that while no single metal dominated investor attention, gold, silver, and copper all held the spotlight evenly—a sign of steady, broad-based engagement across the mining sector.
Engagement by Company Status
The webcast statistics reveal meaningful differences in how investors engage with companies depending on their status in the mining cycle.
Royalty & Streaming companies tend to score disproportionately high in Relative Engagement. These firms are often smaller in number but draw concentrated investor attention, reflecting the market’s appetite for lower-risk exposure to commodity prices and their steady cash-flow models. High relative scores suggest investors are actively benchmarking them against traditional producers.
Producers dominate the raw WEI Index due to their scale and broad following. Their presentations reliably attract the largest audiences, but once adjusted for market capitalization, their relative engagement is more in line with expectations. This indicates that investors view them as essential, baseline holdings rather than emerging stories.
Developers and Explorers show the greatest variability. A few standout names achieve high relative engagement, signaling rising investor curiosity about growth pipelines and discoveries. But many trail off, suggesting that attention is selective—investors are willing to give time only to the most compelling development stories. Nevertheless, despite the massive variability, this year’s stats showed very strong interest in key developers and explorers.
Taken together, the data highlights that while producers command scale, it is often royalty companies and select developers that “punch above their weight” in investor focus. This pattern reinforces the idea that webcast engagement is not only a measure of visibility but also a barometer of market appetite for different risk and reward profiles across the mining sector.
Engagement by Geography
The webcast data highlights how evenly investor attention is spread across geographies, though there are subtle differences in relative strength.
North America (Canada & United States)
Producers and developers in Canada and the U.S. attracted broad viewership and solid WEI scores. Relative Engagement was steady, reflecting both the dominance of North America–listed equities in institutional portfolios and investors’ familiarity with these markets. For larger caps, the scores aligned with expectations, while a handful of juniors in Canada managed to outperform their size.Latin America (Mexico, Peru, Colombia, Brazil, etc.)
Engagement was consistent, particularly for silver-focused companies in Mexico and gold developers in South America. Relative Engagement suggests that investors are keeping one eye on growth pipelines in the region but are selective—rewarding companies with clearer narratives or production visibility.Africa
Companies with African operations showed more variability. Some smaller-cap explorers and developers drew strong relative scores, suggesting that webcast engagement can act as a signal of which names are breaking through the noise. Producers, however, often scored in line with their market size, indicating steady but not disproportionate attention.Oceania (Australia & surrounding region)
Australian companies performed strongly in raw WEI scores thanks to large audiences, and several mid-tier developers earned high relative marks. This reflects both the strong domestic institutional base and global investor curiosity about Australia’s pipeline of gold and base metal projects.Other regions (Europe, Central Asia, multi-asset portfolios)
Engagement was thinner but not absent. Royalty and diversified companies with exposure to multiple geographies tended to carry the attention here.
Overall, the geographic pattern mirrors the commodity-level findings: investors are maintaining broad, steady engagement across regions, with standout relative performers most often being smaller-cap developers or niche plays that surprised on the upside.
Engagement by Subregion
Breaking down the webcast statistics by subregion reveals more granular patterns of investor attention.
North America (Canada & U.S.)
North America remains the anchor of webcast engagement, both in raw WEI scores and relative engagement. Investors consistently devote time to established producers while still giving meaningful attention to select mid-cap and junior companies. Relative strength is balanced, underscoring the region’s centrality to institutional portfolios.South America
Engagement in South America was solid, with developers and mid-tier producers in countries like Peru, Colombia, and Brazil showing healthy relative scores. Investors appear to be rewarding clearer growth pipelines and strong local execution stories, while weaker narratives see less traction.West Africa
West African companies stand out with strong relative engagement despite smaller market caps. This suggests institutional investors are keeping a close watch on the region, particularly as growth projects and M&A opportunities remain on the radar. While the absolute WEI is smaller than in North America or Oceania, the intensity of engagement per dollar of market capitalization is noteworthy.Australia & New Zealand
Oceania’s subregion shows consistently high WEI scores, reflecting both a strong domestic investor base and global interest in its pipeline of projects. Several mid-tier developers outperformed in relative terms, highlighting that investors are highly attuned to emerging stories from the region.Europe & Central Asia
Engagement here was thinner compared to other subregions, but certain niche plays and royalty companies helped lift relative scores. The smaller sample size makes outliers more visible, but it suggests investors remain selective in allocating time to European or multi-country operators.
Overall, subregion analysis highlights the difference between scale-driven engagement in North America and Oceania, and attention-intensity engagement in West Africa and South America. Together, these results show that investors are not ignoring frontier regions—they are closely watching where growth opportunities appear most credible.
Conclusion: From Numbers to Action
Webcast engagement is more than just a statistic; it is a valuable weathervane for investor behavior. The companies with the highest relative engagement are not just presenting; they are connecting. They are shaping the narratives that will define capital flows in the months ahead.
For investors, the real advantage comes not from reading the rankings alone but from watching the webcasts themselves. The data tells us where interest is rising, but only by listening directly can you evaluate the quality of strategy, discipline, and vision behind the numbers.
👉 Explore the webcasts: Whether you are tracking majors, mid-tiers, or high-growth developers, the full library of presentations is open to investors. Use the rankings as a guide to focus your time—then dive in to form your own view of which companies are most compelling.
By combining webcast engagement data with first-hand viewing, you gain both the signal of investor interest and the substance of company performance—a uniquely powerful combination in today’s crowded market.