
Where the Zürich Money Looked: What Webcast Viewership Discloses About 2026 Mining Capital Allocation
What the post-conference engagement data discloses about stage, commodity, and jurisdiction — and why North American developers are absorbing so much institutional attention.

The post-conference webcast library statistics reveal where investors and analysts spend their time digesting corporate presentations. It is an amazing long-tail signal that persists well after an event concludes. Indeed, the on-demand stream is potentially the closest instrument we have for measuring conviction before a trade, because it costs the viewer precious time.
Consequently, the viewership data from Mining Forum Europe 2026 (Zürich, April 13–15) merits detailed examination. The results of sixty member companies, with engagement spanning views, cumulative watch hours, and per-view dwell time, reveal more than a month’s worth of video consumption.
A note on the figures. To protect confidential information, this article reports engagement metrics as indexed values rather than absolute counts. The cohort leader on each metric is assigned a value of 100, and all other companies are expressed as a percentage of that leader. Rankings, ratios, dispersion, and gradients are preserved exactly; absolute volumes are not disclosed. Market capitalizations and trailing returns, which are public market data, appear at their actual values.
The Concentration Discloses the Hunt
The top five presenting companies absorbed 41.1 percent of total views, the top ten 56.3 percent, and the top fifteen nearly two-thirds of all attentional spend. A Pareto distribution of this severity is unremarkable in itself, since investor attention has always concentrated, however the composition of that concentration is the operative finding.
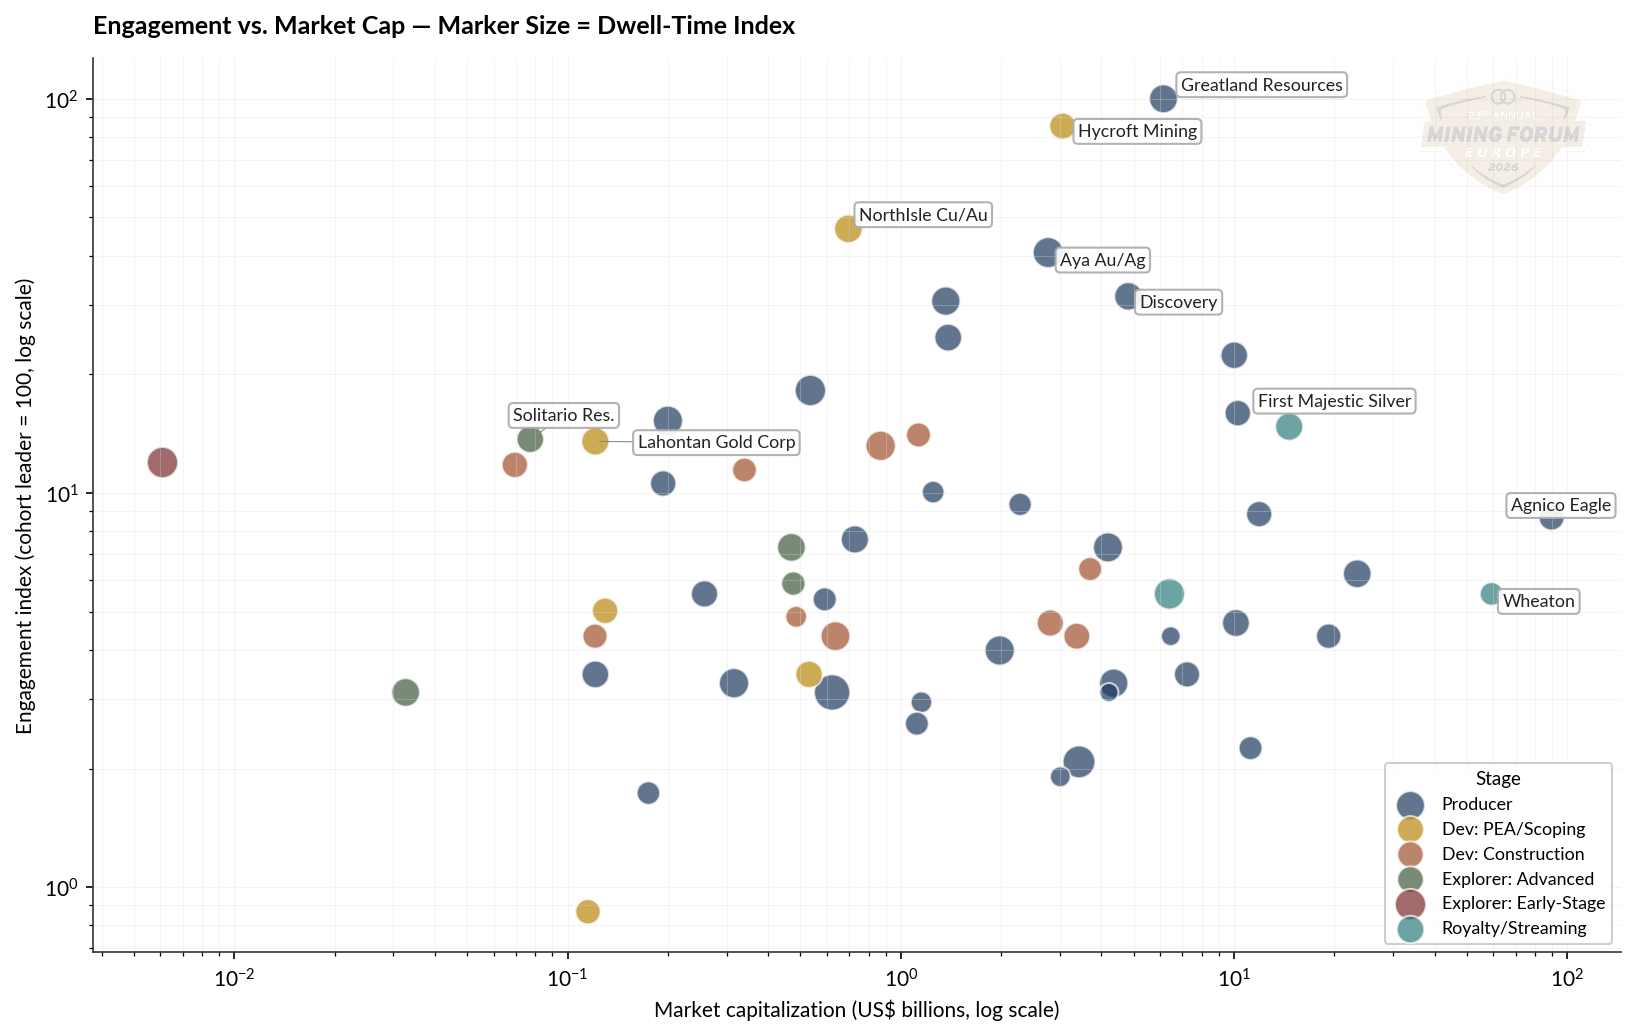
The five names at the head of the table, in descending order of cumulative engagement, are Greatland Resources [$9.13 | $6.1Bn] (engagement index 100, by definition the cohort leader), Hycroft Mining [$33.50 | $3.1Bn] (index 73), NorthIsle Copper and Gold [$2.10 | $696M] (index 46), Aya Gold & Silver [$19.32 | $2.8Bn] (index 47), and Discovery [$5.94 | $4.8Bn] (index 31). Of those five, only one, Aya, is a conventional mid-cap producer; the other four are either developer-stage stories with catalysts pending or producers whose narrative is functionally indistinguishable from a developer’s. Greatland and NorthIsle in particular are pre-production names whose institutional thesis depends on permits, financing, and feasibility milestones that the market is presently underwriting at substantial premia.
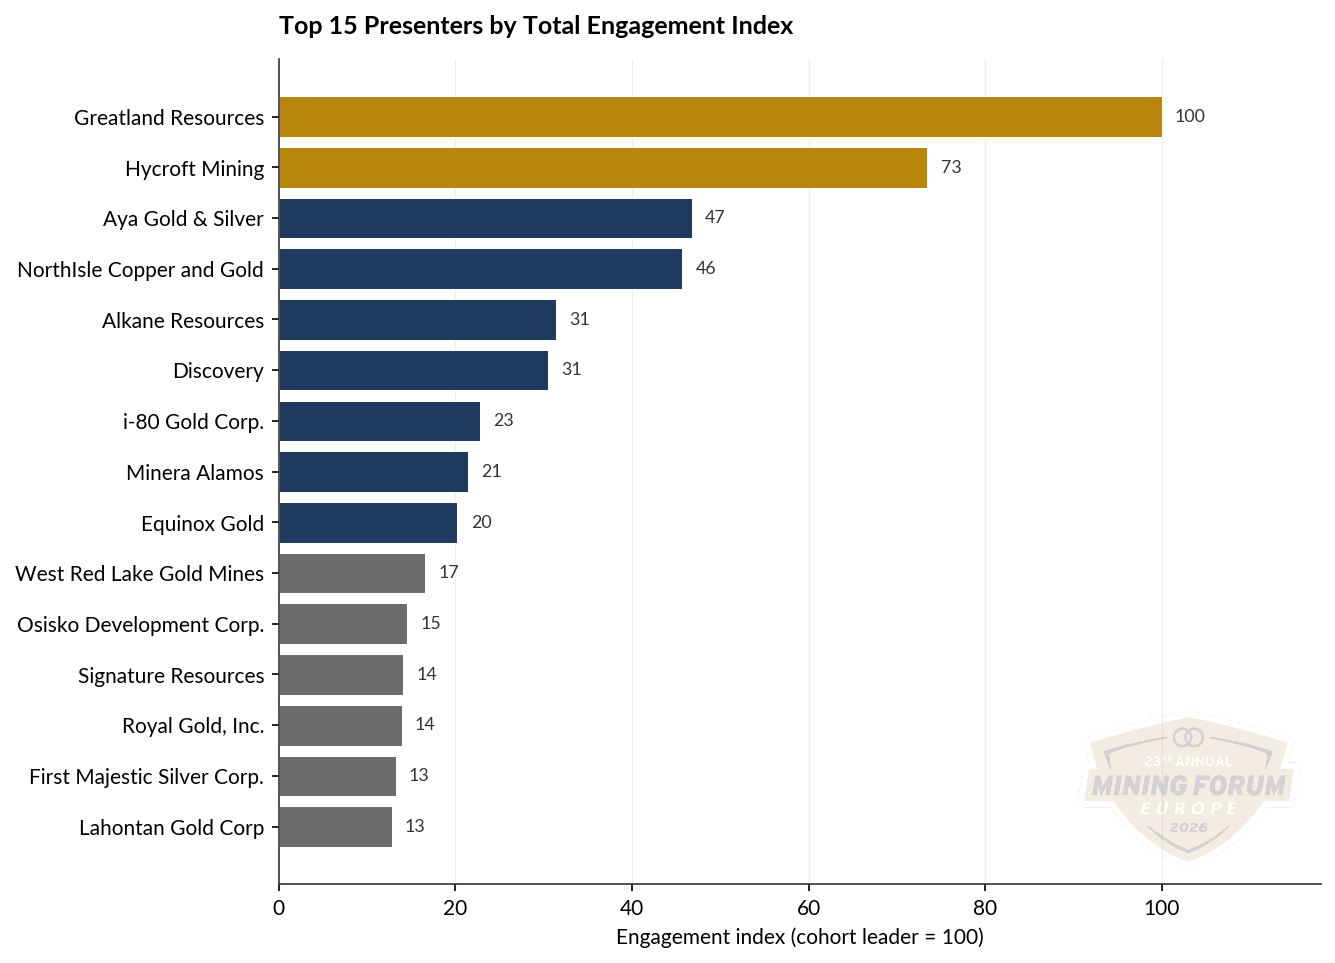
The largest names by enterprise value did not command the largest share of post-conference institutional attention, and the inversion is not a quirk of the data but a category of evidence suggesting that optionality is highly prized at this point in the cycle.
The Stage Inversion
Producers, who constitute 100/209 DGG member companies, accounted for 58.1 percent of total views. That share is proportionate, however, Developer (PEA/scoping) members, of whom only twenty-one exist in the DGG corpus and only six appeared in the webcast cohort, absorbed 20.9 percent of total views, which is to say that this stage segment over-indexed against its membership representation by a factor of roughly four. On a per-company-mean basis, normalizing the producer cohort to 100, the PEA/scoping segment indexes at 210, the early-stage explorer segment at 81, royalty/streaming at 70, construction/feasibility developers at 65, and advanced explorers at 61. The market is paying a structural attention premium to stories that are pre-cashflow, pre-construction-decision, and dependent on a sequence of catalysts that have yet to be fully priced.
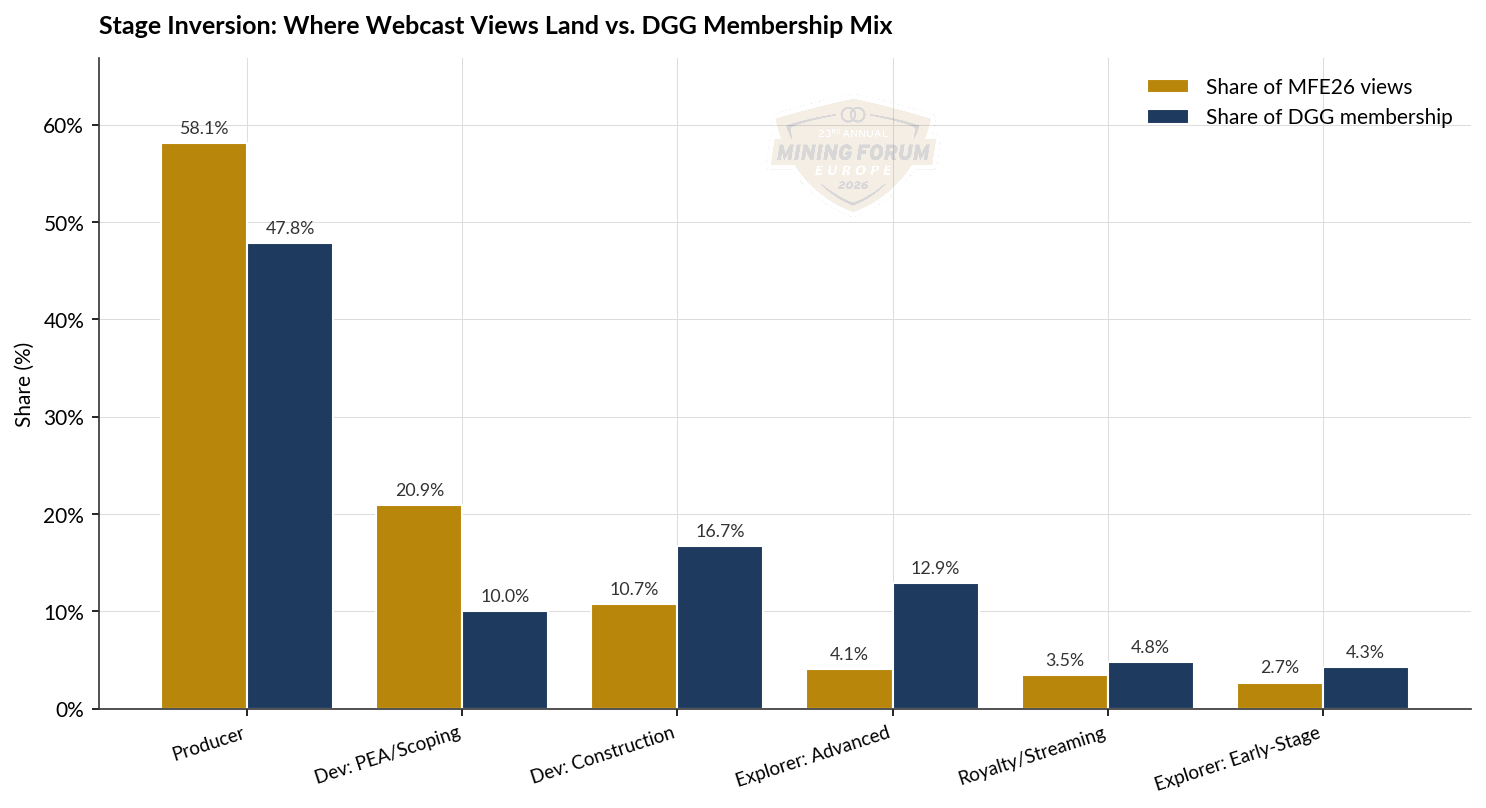
Indeed, the dispersion by stage is so pronounced that it functions as a leading indicator of where 2026 and 2027 capital expenditure announcements may originate and ahead of possible equity raises.
Geography and Commodity: The Compounding Effects
The stage-level inversion documented above does not operate in isolation. When the cohort is sliced by primary commodity and primary jurisdiction of operation, two further axes of dispersion emerge, and the interaction between them sharpens rather than dilutes the central thesis. Capital is not merely chasing the pre-cashflow stage; capital is chasing the pre-cashflow stage in specific jurisdictions.
Regional Concentration: The Oceania Surprise and the African Discount
The aggregate regional distribution is best read alongside the share of presenters from each region, since proportionality is the operative test. The Americas region, comprising forty-one of the sixty cohort presenters, absorbed 65.7 percent of all webcast views, which is, on its face, proportionate to its 68.3 percent share of presenter slots. The story is in the smaller regions. Oceania, with seven presenters or 11.7 percent of the cohort, absorbed 21.6 percent of all views, an over-index of roughly 1.8 times on a share basis. Africa, also with seven presenters, absorbed 8.9 percent of views, an under-index of approximately 0.8 times. Europe, with four presenters, absorbed 3.4 percent. Asia, with a single presenter, absorbed 0.4 percent.
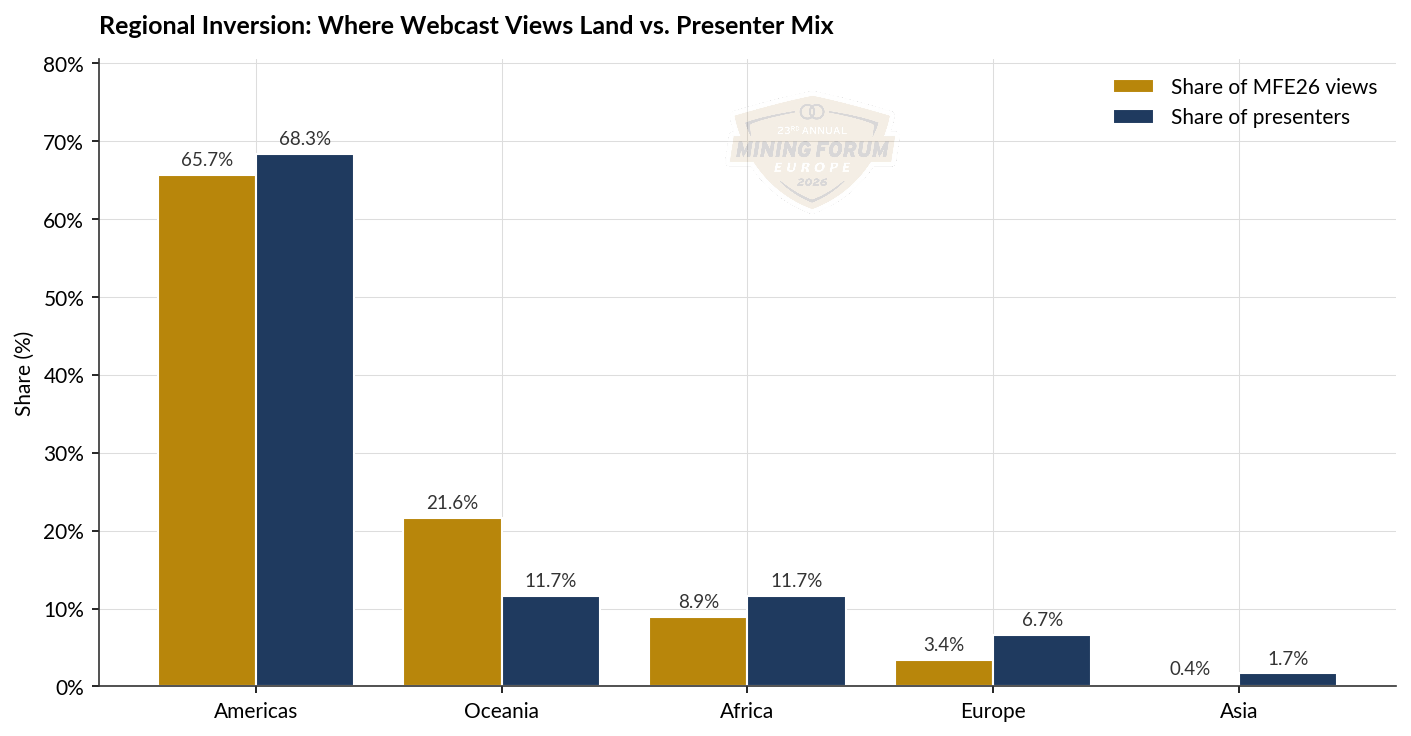
Of the regional Oceania total, Greatland Resources alone, an Australian gold-copper developer-to-producer story, accounts for the lion’s share. Strip Greatland out of the Oceania cohort, and the regional mean view index falls from 23 to roughly 12, which is to say proportionate to the Americas. The Oceania finding is therefore not necessarily a structural Australian premium; it is the Greatland phenomenon expressed at the regional aggregation level. The remaining Australian and Papua New Guinean names (Alkane [$1.00 | $1.4Bn], K92 Mining [$13.55 | $4.2Bn], Ramelius Resources [$2.22 | $4.2Bn], and others) sit closer to the cohort median than to its leader.
The African discount, by contrast, is structural at this point. Seven African presenters delivered a mean view index of 9 against a cohort mean of approximately 14, with a mean dwell index of 48 against the cohort norm of roughly 56, and a mean trailing one-year total return of 37 percent against the cohort mean above 130 percent. Western Africa is the most pronounced underperformer at every level, with Galiano Gold [$2.26 | $591M], Fortuna Mining [$9.94 | $3.0Bn], and Newcore Gold collectively averaging a view index in the mid-single digits and dwell indices well below cohort. Eastern and Southern Africa, comprising DRDGOLD [$2.63 | $2.3Bn] and Kenmare Resources [$2.79 | $258M] at the producer level, fare little better. The sole African exception is Aya Gold & Silver in Morocco, which sits in the top five of the entire cohort on engagement and posted a 117.9 percent trailing return. Northern Africa, in other words, is not analytically grouped with sub-Saharan Africa by the European institutional pool; Morocco trades more closely with a Southern European jurisdiction than with its continental peers, probably because of rising sovereign risks elsewhere on the continent.
The North American Developer Outperformance
The single sharpest cross-cut in the dataset, however, is the comparison between North American developers and developers domiciled elsewhere. The North American developer cohort, comprising eleven companies operating primarily in the United States or Canada, registers a per-company mean view index more than 2.6 times that of the five non-North American developers in the captured cohort. Mean dwell time is broadly comparable between the two groups, however the engagement intensity, measured by sheer view volume, is materially different. The trailing one-year total return spread is the more remarkable finding: North American developers averaged 258.1 percent, compared with 110.3 percent for the rest-of-world developer cohort, a ratio of roughly 2.3.
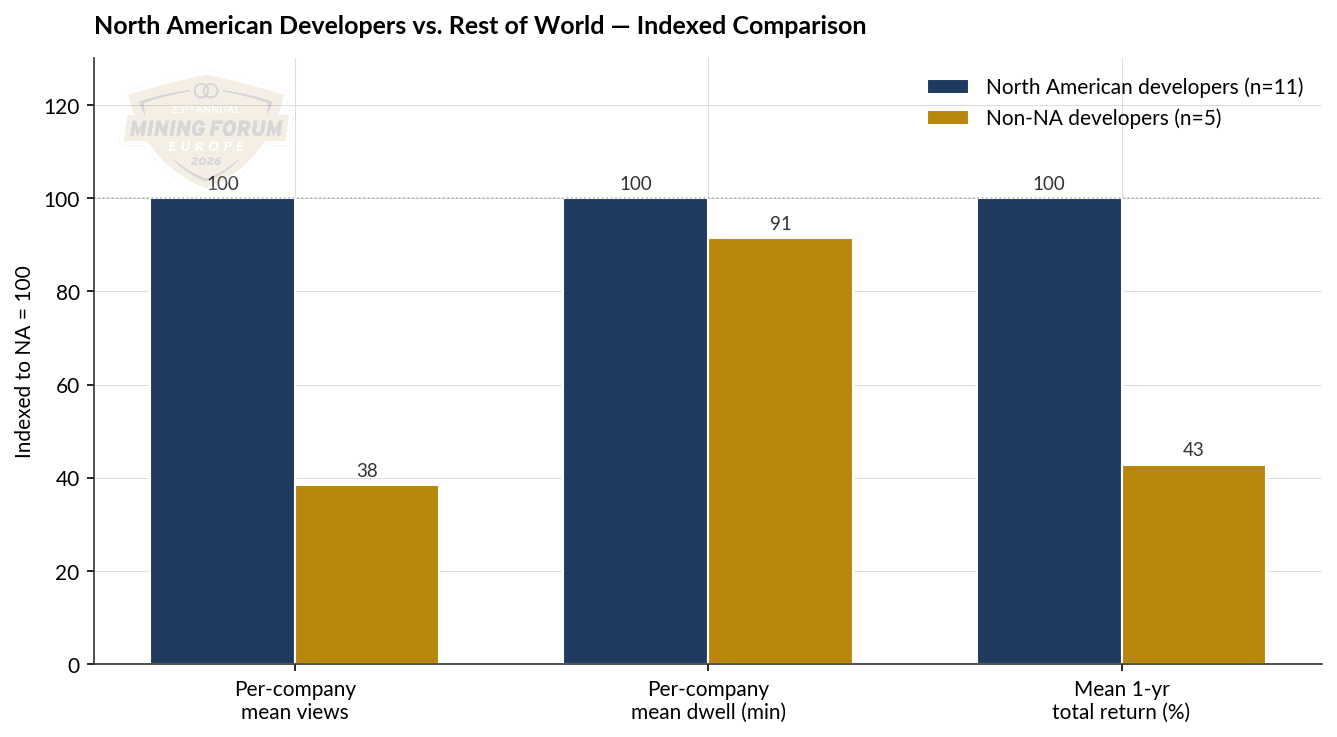
The composition of the North American developer cohort discloses the underlying thesis. United States nameplates, specifically Hycroft Mining (Nevada), Lahontan Gold Corp [$0.29 | $121M] (Nevada), Liberty Gold Corp. [$1.20 | $637M] (Idaho and Nevada), Perpetua Resources [$26.97 | $3.4Bn] (Idaho), and NOVAGOLD [$8.43 | $2.8Bn] (Alaska), account for the majority of the views, and their one-year returns range from 91.4 percent to 951.97 percent, with a cohort-leading return profile that the buyside appears to have substantially anticipated. Canadian developers, including NorthIsle Copper and Gold (British Columbia), Osisko Development [$2.86 | $870M] (multiple Canadian jurisdictions), and Abcourt Mines Inc. (Quebec), round out the cohort and contribute to the regional skew. Capital is, in plain English, underwriting the political-permitting tailwind that the United States and Canada are currently understood to offer to the construction-stage gold and silver development pipeline, and the European institutional pool has done the work to position for the next financing windows in that pipeline.
Commodity Cuts: Gold Dominates Slots, Copper Dominates Per-Company Attention
The commodity distribution is asymmetric in a different sense. Gold-primary companies constituted fifty of the sixty cohort presenters, or 83 percent of slots, and absorbed 80.2 percent of total views, which is essentially proportionate. Silver-primary companies, comprising eight of the cohort, delivered a per-company mean view index of 99 against a gold baseline of 100, which is to say silver indexes at parity with gold on engagement, however the silver cohort posted a substantially higher mean trailing one-year return of 192 percent against gold’s 122 percent. Silver is being underwritten with comparable analytical attention but has delivered a measurably superior return profile, a finding that should be expected to feature in 2026 commodity-weighted allocation discussions.
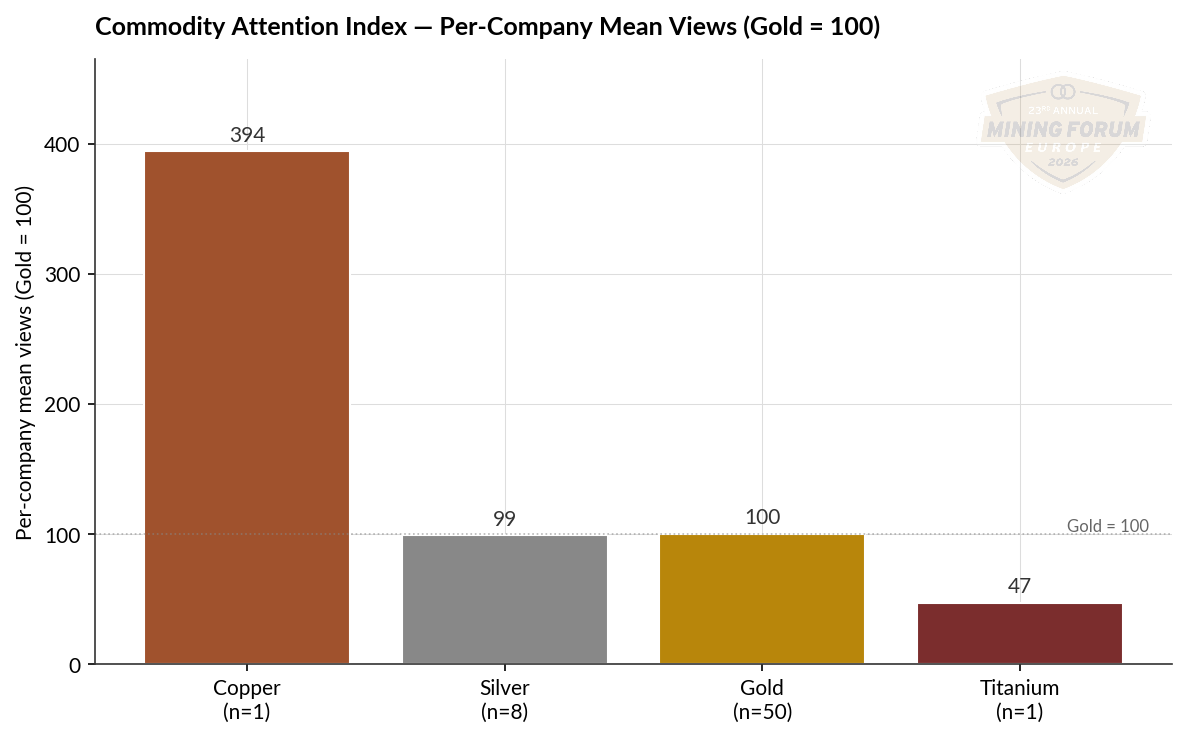
The copper finding, while statistically thin at n=1, is worth flagging. The sole copper-primary presenter in the captured cohort, NorthIsle Copper and Gold, sits at engagement index 47, the third-highest in the cohort, and posted a trailing return of 212.9 percent. The implication is not that copper-primary names are systematically attention magnets, since the sample size precludes that conclusion, but rather that the MFE conference programming committee should expect copper-primary applications for MFA26 to be received with substantial buyside interest. The structural under-allocation of copper-primary presentation slots relative to copper-primary investor interest is the operational finding for conference programmers and member acquisition staff.
The silver cohort, finally, geographically concentrates in Mexico (First Majestic Silver Corp., Avino Silver & Gold Mines, Guanajuato Silver) and the United States (Hecla Mining, Andean Precious Metals, Americas Gold & Silver), with two notable peripheral additions in Aya (Morocco) and Kuya Silver [$1.13 | $48M] (Peru). The Mexican silver-jurisdiction concentration is the operational corollary to the North American developer finding above, in that capital is paying simultaneously for jurisdictional clarity, commodity exposure, and the developer-to-producer-stage transition. The intersection of those three vectors is where the cohort’s highest engagement-and-return signals concentrate.
Dwell Time as Conviction Proxy
Raw view counts are necessary but insufficient. The companion variable, average watch duration, is, in many respects, the more revealing one, because it filters out click-curiosity from substantive analytical engagement. Against a dwell-time leader normalized to 100, the cohort mean watch time indexes at 56, which is to say that viewers were consuming between half and two-thirds of the median presentation, a high completion ratio by any reasonable industry benchmark.
The names in the dwell-time top ten are not, with one or two exceptions, the names at the top of the view-count leaderboard, and that decoupling is itself informative. A high view count with a moderate dwell time, as exhibited by Hycroft Mining at a view index of 85 against a dwell index of 54, indicates broad institutional triage; many desks looked, fewer stayed to the end. A moderate view count with a long dwell time, as exhibited by Contango [$20.22 | $622M] or Signature Resources [$0.03 | $6M], indicates the inverse profile, namely a smaller and more deliberate analytical cohort that watched the presentation to completion and very likely returned to sections they wished to re-examine.
Short dwell times are consistent with viewers checking for incremental disclosure rather than absorbing the narrative from scratch. That pattern, repeated across multiple majors, is consistent with a market that has already priced what it knows about producer fundamentals and is allocating its incremental attention elsewhere.
The Views-per-Market-Cap Disproportion
Normalizing total views by market capitalization isolates the names where institutional attention is structurally disproportionate to enterprise value, and the resulting table is, in our judgment, the single most actionable cut of the data.
Solitario Resources Corp. [$0.83 | $77M], at a $77.3 million market capitalization, leads the disproportion table at index 100, by definition. Abcourt Mines Inc. [$0.06 | $69M] follows at index 96. Lahontan Gold Corp indexes at 63. West Red Lake Gold Mines [$0.48 | $200M] at 43. NorthIsle Copper and Gold at 38. ORVANA [$1.42 | $194M] at 31. Each of these names sits at least an order of magnitude above the cohort median on this metric, and four of the six are pre-production or early-production stories whose share price performance over the trailing twelve months has been correspondingly distinguished, with Lahontan up 381 percent, NorthIsle up 213 percent, and ORVANA up 228 percent. Notably, five of the six disproportion leaders operate primarily in North America, which reinforces the regional outperformance finding established in the previous section.
The corollary finding, that one-year total returns increase across view quartiles, is the empirical capstone.
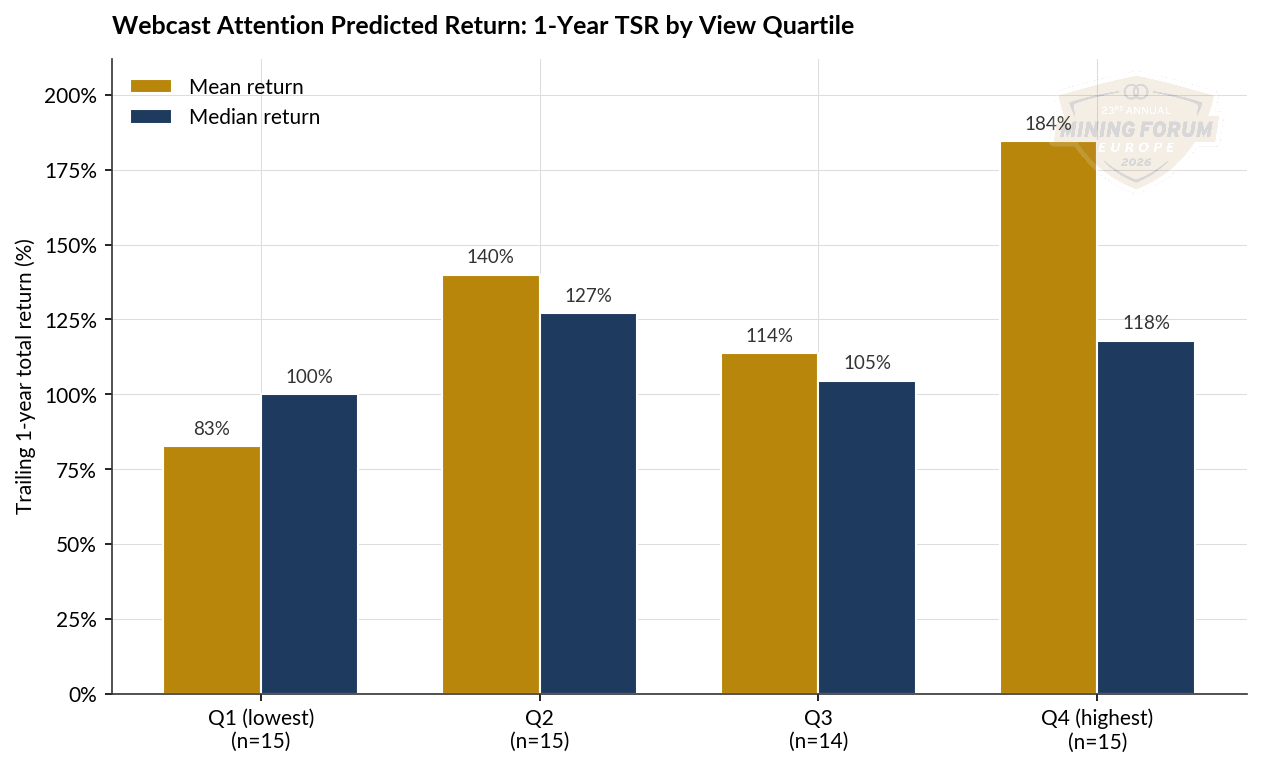
The first (lowest) view quartile posted a mean trailing return of 82.6 percent. The second posted 139.9 percent. The third posted 113.7 percent. The fourth (highest) posted 184.5 percent. Webcast viewership at MFE25 and across the intervening cycle was, in other words, a leading indicator of price performance in the year that followed. The crowd, on this evidence, was right; the buy-side identified the names that worked, watched them with measurable intensity, and the market subsequently confirmed the thesis.
What the Data Forecasts for 2026 Capital Allocation
Several conclusions follow, each with implications for capital expenditure and capital allocation over the balance of the cycle.
First, the developer cohort will be the source of the bulk of 2026 institutional financing activity, and the North American developer subset will be where the activity concentrates. Hycroft Mining’s 951.97 percent trailing return, paired with an engagement index of 73 against the cohort leader, is not a retrospective curiosity; it is a template. Buyside desks that have already absorbed that volume of company narrative are, by the time the bookbuild opens, in a position to participate at scale. Expect the equity-raise calendar from the United States and Canadian PEA-scoping and construction-feasibility cohorts to remain unusually active, with particular emphasis on the project pipelines in Nevada, Idaho, British Columbia, and Quebec.
Second, the silver and silver-leveraged producers continue to command structurally disproportionate attention relative to their market capitalizations and have delivered the highest returns among commodity cohorts. Aya Gold & Silver, First Majestic Silver Corp., and Minera Alamos all over-indexed in the captured cohort, and the geographic concentration in Mexico and the United States compounds with the developer-stage premium documented above. Capital allocation decisions in the silver developer-to-producer transition should be expected to follow, with particular focus on Mexican and US-jurisdictional names.
Third, the African presentation cohort, with the singular Moroccan exception, is being systematically discounted by the European institutional pool. Western African gold producers, in particular, are receiving roughly half the engagement intensity and one-third the trailing returns of the cohort mean, and dwell-time data indicate that the discount is not a function of unfamiliarity but of active disengagement. Members operating primarily in West African jurisdictions should expect a structural attention gap to persist absent material disclosure events.
Fourth, and consequently, the names sitting at the intersection of high view count, long dwell time, North American jurisdiction, and modest market capitalization, namely the cohort that includes Greatland, NorthIsle, Aya, Minera Alamos, Discovery, Alkane, i-80 Gold [$1.61 | $1.4Bn], and the West Red Lake Gold Mines / Lahontan / Hycroft cluster, are the names whose 2026 and 2027 capital expenditure announcements, project financings, joint ventures, and merger and acquisition activity will be most heavily anticipated by the European institutional pool an leading into Mining Forum Americas 2026 this coming September. The pre-positioning is already in the data; the realization will follow in the calendar.
Methodological Note
Webcast viewership is not, and has never been, a substitute for fundamental analysis, technical disclosure review, or independent due diligence. The metrics presented here measure attentional flow, not geological merit, financing capacity, or management quality. Nevertheless, in markets where information asymmetry has been substantially compressed by regulatory disclosure regimes and where the marginal investor’s edge is increasingly procedural rather than informational, the question of which presentations the institutional cohort chose to rewatch, and for how long, is itself a question of professional consequence. The MFE26 dataset answers it with unusual clarity.
The full session library remains available at https://europe.miningforum.com/agenda/
The next major checkpoint, Mining Forum Americas 2026, convenes September 27–30 at The Broadmoor in Colorado Springs, and registration and viewership patterns from MFE26 already suggest a follow-on cycle of heightened interest among developer cohorts, particularly in North American jurisdictions. We will return to this dataset when the autumn numbers are in.